






Overview
JDA/BY has a very useful feature that allows for detailed tracing of a server component. It provides information about every single server component, parameter and also all SQLs that are executed. But that also ends up being an issue as the traces would often reach several gigabytes. Analyzing them becomes a problem.
Our Solution
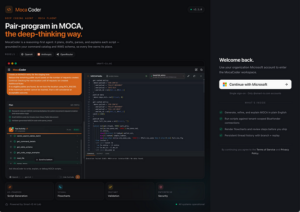
Smart IS has created a client software that allows for executing MOCA commands. It can be downloaded from Here . We have incorporated an advanced Trace Viewer into this application that allows for analyzing such trace files. The concepts are based on some of the concepts described in my earlier blog.
Database Trace Option
When you have our MOCA Client, you can access the “MOCA Log” pull-down menu:

As described in the earlier blog post, we will be pushing the trace to a set of tables in the database. So in the screen, you can press the button to create the tables on the instance. This needs to be done only once.

Now you can choose the trace file you want to load from the instance by pressing the insert button. There is no upper limit on the size of trace file. You will be able to process several Gigabyte trace file and the client will give you progress update. Once the trace file has been parsed the parsed view is stored in a set of database tables so re-analyzing it does not require re-parsing.
The parser views the trace file as having three high-level perspectives:
- Activity. This is from the point of view of a client that accessed a service provided by MOCA
- Commands. These are the various MOCA commands
- SQLs. These are the SQL statements that are executed
Activity View
As you select a trace file from the top grid, the various Activities will be displayed in the order of execution along with the time spent on each:
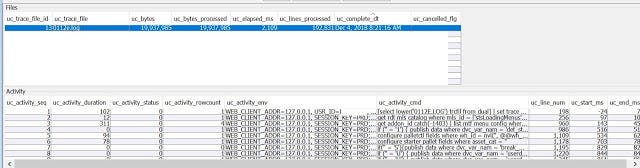
You may sort the grid as you see fit. Each row here implies an interaction from the client (e.g. RF or GUI user) with the MOCA server. Being able to view this is a huge benefit when trying to make sense of huge trace files as our interesting area may be one of several activities. As you can notice that the client makes several calls to the MOCA server for house-keeping activities which create a lot of noise to filter through. You can right click on any row here and export just that part of the trace file:
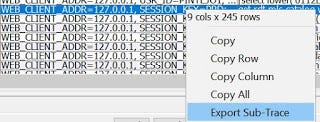
The exported trace file can be processed in any way you like, i.e. in a trace viewer of your choice.
Here you have two tabs “SQL” or “Commands” to do further analysis:

You can choose a tab and then press “Analysis” button.
SQL Analysis View
You can perform the analysis of the whole trace file or of a certain activity. You decide that based on the filter section:

This shows a grid that has all SQLs within the context. The SQLs here are the ones with bind variables. This implies that we group like SQL statements. This is extremely helpful when we are looking at a trace from the point of view of performance tuning:
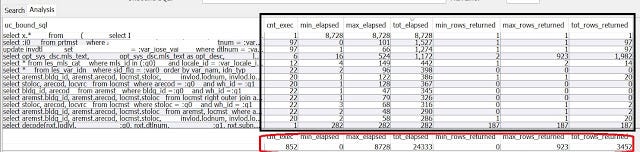
You can sort the data as you see fit. For example, while looking for performance improvements, sorting by tot_elapsed can be quite helpful. There is also a summary section to separate the tracing overhead from the execution overhead. The above example highlights that there is a single SQL statement that took 8 seconds. Also, the second one is executed very frequently and even though each execution was sub-second (0 ms to 101 ms) adding them together comes to 1.5 seconds which can be significant when looking at a transaction like inventory movement.
You can right click on any row here to see further options:
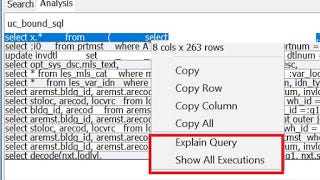
- Show all executions will show each execution. As you can see below it provides a summary view and also the time for each execution. It also provides contextual information about the command that executed it and also the line number in the trace file.

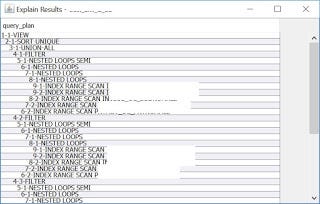
- Explain query will show an execution plan. This is very useful as the explain plan is really dependent on the query with bind variables. A common mistake is to analyze queries with bind variables replaced. This provides a simple mechanism to get the trace
Command Analysis View
Like SQL Analysis, you can do command level analysis as well. You can analyze the whole trace or focus on an activity. Once you analyze you see similar output but from the point of view of MOCA commands:
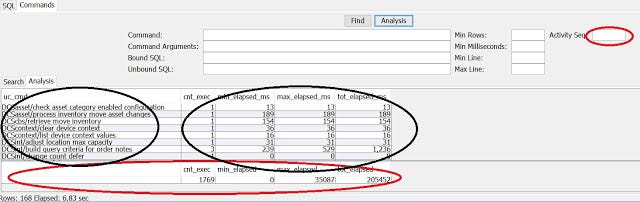
You can see summary view and also similar statistics for the various commands within the analysis context. You can for example focus in on a command that may be executed too often causing overall performance degradation.
Trace View Option
You also have the traditional option of viewing the trace file as a tree view or detailed view. Here too we have several advantages over the competing options:
- We can look at part of huge trace
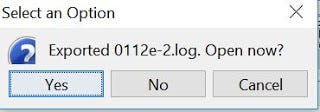
As mentioned above when we right click on an activity we can create a trace for just that portion. That sub-trace is opened into the trace viewer:

- Ability to filter out noise
When we open a trace file, we get an option to filter out some typical parts of the trace to make it easier to view.
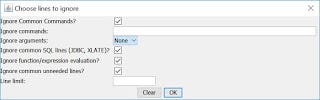
This will reduce the resulting view significantly as the common housekeeping commands in MCS and MOCA will be ignored. You can also put additional commands to ignore. This also reduces the size by getting rid of some other parts of the trace.
- Tree View and Detailed View in side by side panes
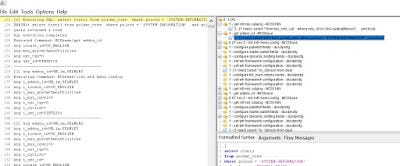
Above enhancements allows us to view very large trace files in this view as well. Then we can see the contents in two panes where right side shows it as a tree and left side as text:
- View Arguments in a tab
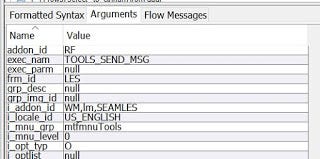
We can highlight a command in the tree view to see the arguments that are available to it in the Arguments tab:
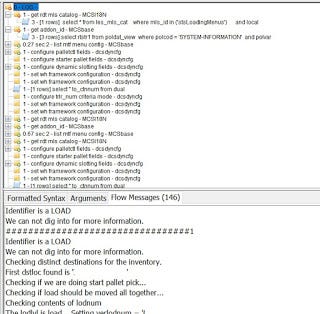
- Easily see FLOW messages
MOCA code may put explicit trace messages as FLOW type. These provide explicit trace hints that can be valuable in making sense of a complex command. The “Flow Messages” tab shows such messages based on the selected node of the tree:
Conclusion
JDA/BY server tracing option is very valuable and provides a tool to perform in depth analysis and troubleshooting. Complex use cases become difficult due to the size of the trace file. Our approach provides us a solution to focus on the problems and eliminating noise. Our consultants are also users of our tools so this allows us to improve these by utilizing their feedback. If you have any questions or comments please contact us.
Originally published on saadwmsblog.blogspot.com