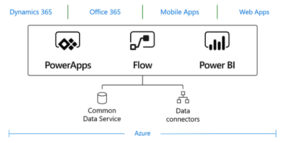
Power Platform:
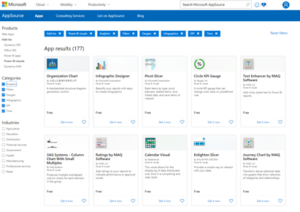
The ‘Power Platform’ is a collective term for three Microsoft products: Power BI, PowerApps and Power Automate (previously known as Flow). They provide the means to help people easily manipulate, surface, automate and analyze data and can be used with Office 365 and Dynamics 365 (as well as other third-party apps and other Microsoft services). The Power Platform is possible thanks to the Common Data Service (or CDS), which is essentially the underlying data platform that provides a unified and simplified data schema so that applications and services can inter-operate.
 In this digital age, we are extremely reliant on data – and the amount of data companies are creating is continually increasing. While all this data is inevitable, it is useless unless companies gain insights and meaning from it - to gain tangible value.
Historically, data analysis, app creation or automation would be achieved by IT/Development teams. This would require staff to outline their requirements and aims, submit these requests to their IT department (or even an external partner) and then see whether it was approved and subsequently, wait for it to be built. This would be time-consuming and would use valuable resources internally or be costly if fulfilled externally. What are more, those requesting the solution would tend to have an immediate need and waiting for weeks could cause internal delays.
Therefore, the Power Platform is so exciting. The Power Platform enables data democratization – the ability for digital information to be accessible to the typical (non-technical) end user. It provides three technologies that allow staff to do more with their data themselves without coding knowledge. While it does not allow the intricacies and flexibility of custom coding, it does provide a simple method for most users to be able to create, automate or analyze their data in ways which have never been possible for the average worker.
In this digital age, we are extremely reliant on data – and the amount of data companies are creating is continually increasing. While all this data is inevitable, it is useless unless companies gain insights and meaning from it - to gain tangible value.
Historically, data analysis, app creation or automation would be achieved by IT/Development teams. This would require staff to outline their requirements and aims, submit these requests to their IT department (or even an external partner) and then see whether it was approved and subsequently, wait for it to be built. This would be time-consuming and would use valuable resources internally or be costly if fulfilled externally. What are more, those requesting the solution would tend to have an immediate need and waiting for weeks could cause internal delays.
Therefore, the Power Platform is so exciting. The Power Platform enables data democratization – the ability for digital information to be accessible to the typical (non-technical) end user. It provides three technologies that allow staff to do more with their data themselves without coding knowledge. While it does not allow the intricacies and flexibility of custom coding, it does provide a simple method for most users to be able to create, automate or analyze their data in ways which have never been possible for the average worker.
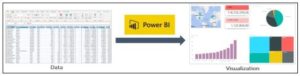
 Power BI is a business analytics tool which allows you to easily connect to data sources, create visuals and gain business intelligence quickly. Power BI is a business analytics service provided by Microsoft that lets you visualize your data and share insights. It converts data from different sources to build interactive dashboards and Business Intelligence reports.
Power BI is a cloud-based business analytic solution, which is used to analyze data from a wide range of data sources. It is simple to use as well as user-friendly. The insights obtained can be shared across an organization and can be rooted in the organization’s app or website. With Power BI, you can create as well as productive with the reports and analytics.
Power BI is a business analytics tool which allows you to easily connect to data sources, create visuals and gain business intelligence quickly. Power BI is a business analytics service provided by Microsoft that lets you visualize your data and share insights. It converts data from different sources to build interactive dashboards and Business Intelligence reports.
Power BI is a cloud-based business analytic solution, which is used to analyze data from a wide range of data sources. It is simple to use as well as user-friendly. The insights obtained can be shared across an organization and can be rooted in the organization’s app or website. With Power BI, you can create as well as productive with the reports and analytics.
 How Power BI benefits businesses?
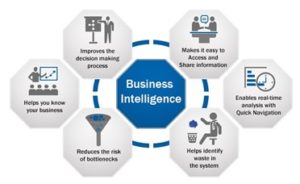
Business Intelligence, BI is a concept that usually involves the delivery and integration of relevant and useful business information in an organization. Companies use BI to detect significant events and identify/monitor business trends to adapt quickly to their changing environment and a scenario. If you use effective business intelligence training in your organization, you can improve the decision-making processes at all levels of management and improve your tactical strategic management processes.
How Power BI benefits businesses?
Business Intelligence, BI is a concept that usually involves the delivery and integration of relevant and useful business information in an organization. Companies use BI to detect significant events and identify/monitor business trends to adapt quickly to their changing environment and a scenario. If you use effective business intelligence training in your organization, you can improve the decision-making processes at all levels of management and improve your tactical strategic management processes.
 Microsoft Power BI is a suite of business intelligence (BI), reporting, and data visualization tools and services for businesses. It converts your raw data into dashboards and visualizations. This allows you to analyze your data more efficiently, spot trends and patterns, and obtain actionable insights to make better business decisions.
 It allows you to:
• Click and connect with Microsoft and third-party cloud services, as well as on-premises data sources.
• Gives you access to real-time information. Supports a wide range of data sources and integrations.
• Allows you to build personalized dashboards and interactive reports easily.
• Easily manipulate data and create visuals, such as charts, dashboards, maps and many more – so you can present your data in an easy-to-digest format.
• Allows you to deploy multiple dashboards with Power BI Apps.
• Have cutting-edge AI feature.
• Use natural language to query data and get results (i.e., “show me our sales pipeline for 2018 by month, by salesperson”)
• Overall, allowing you to easily analyze and make sense of complex data to enable continual improvement.
• Is affordable and cost-effective.
Why should you use Power BI?
Power BI offers data preparation and discovery, interactive dashboards, and rich visualizations in one solution, and its self-service capabilities make it an intuitive tool for interacting with data and turning it into insights more easily. Here are our top 8 reasons why you should use Power BI for data analytics and self-service business analytics.
1. It is easy to connect your data together.
It allows you to:
• Click and connect with Microsoft and third-party cloud services, as well as on-premises data sources.
• Gives you access to real-time information. Supports a wide range of data sources and integrations.
• Allows you to build personalized dashboards and interactive reports easily.
• Easily manipulate data and create visuals, such as charts, dashboards, maps and many more – so you can present your data in an easy-to-digest format.
• Allows you to deploy multiple dashboards with Power BI Apps.
• Have cutting-edge AI feature.
• Use natural language to query data and get results (i.e., “show me our sales pipeline for 2018 by month, by salesperson”)
• Overall, allowing you to easily analyze and make sense of complex data to enable continual improvement.
• Is affordable and cost-effective.
Why should you use Power BI?
Power BI offers data preparation and discovery, interactive dashboards, and rich visualizations in one solution, and its self-service capabilities make it an intuitive tool for interacting with data and turning it into insights more easily. Here are our top 8 reasons why you should use Power BI for data analytics and self-service business analytics.
1. It is easy to connect your data together.
 Power BI makes it incredibly easy to bring your data together into one place, for greater accessibility, organization, and visibility in your reporting efforts. The tool currently supports up to 70+ connectors out-of-the-box, letting businesses load data from a wide range of highly used cloud-based sources such as Azure (Azure Data Warehouse), DropBox, Google Analytics, OneDrive and SalesForce, in addition to Excel spreadsheets, CSV files and data located on-premises, such as SQL Database.
2. It is powerful and performant.
Power BI makes it incredibly easy to bring your data together into one place, for greater accessibility, organization, and visibility in your reporting efforts. The tool currently supports up to 70+ connectors out-of-the-box, letting businesses load data from a wide range of highly used cloud-based sources such as Azure (Azure Data Warehouse), DropBox, Google Analytics, OneDrive and SalesForce, in addition to Excel spreadsheets, CSV files and data located on-premises, such as SQL Database.
2. It is powerful and performant.
 Power BI’s Power Pivot data modelling engine (which is shared with Excel) is a highly performant columnar database.
3. It has custom, open sources visuals.
Power BI’s Power Pivot data modelling engine (which is shared with Excel) is a highly performant columnar database.
3. It has custom, open sources visuals.
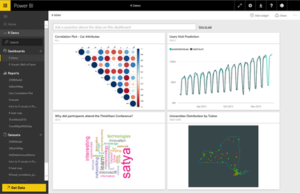
 Power BI comes with a ton of pre-packed standard data visuals to leverage in your interactive reports, such as bar, column, line, map, matrix, pie charts, scatter, table and waterfall - each with their own variety of customization options for enhanced presentation and functionality.
4. Advanced data experts can leverage its native R integration.
Power BI comes with a ton of pre-packed standard data visuals to leverage in your interactive reports, such as bar, column, line, map, matrix, pie charts, scatter, table and waterfall - each with their own variety of customization options for enhanced presentation and functionality.
4. Advanced data experts can leverage its native R integration.
 Power BI lets you integrate these detailed R visualizations directly into a standard dashboard.
5. Enable more advanced analytics with familiar Excel features.
Power BI lets you integrate these detailed R visualizations directly into a standard dashboard.
5. Enable more advanced analytics with familiar Excel features.
 Advanced Excel users knowledgeable in Data Analysis Expressions (DAX) formula language can dig deeper into their data and find patterns easier with Power BI with its familiar Power Pivot features like clustering, forecasting, grouping and quick measures.
6. It brings together data governance and security.
Advanced Excel users knowledgeable in Data Analysis Expressions (DAX) formula language can dig deeper into their data and find patterns easier with Power BI with its familiar Power Pivot features like clustering, forecasting, grouping and quick measures.
6. It brings together data governance and security.
 Power BI lets you manage security and user access and security within the same interface, removing the need to use other tools to ensure you meet stringent compliance and regulatory standards.
The service also has Azure Active Directory (AAD) built-in for user authentication, allowing you to leverage Single Sign-On (SSO), along with your regular Power BI login credentials to access your data.
7. You can ask questions and get answers about your data.
Power BI lets you manage security and user access and security within the same interface, removing the need to use other tools to ensure you meet stringent compliance and regulatory standards.
The service also has Azure Active Directory (AAD) built-in for user authentication, allowing you to leverage Single Sign-On (SSO), along with your regular Power BI login credentials to access your data.
7. You can ask questions and get answers about your data.
 Power BI incorporates natural language search interfaces to allow users to create visualizations and discover insights using search terms in plain English, without the need for code or syntax.
Using the Q&A feature, you can explore more specific insights by double clicking an empty part of your report canvas and using the ‘Ask a Question’ box to ask data-specific questions like “what were the sales for [region] by quarter”.
8. You can embed Power BI tiles into your custom PowerApps apps.
Power BI incorporates natural language search interfaces to allow users to create visualizations and discover insights using search terms in plain English, without the need for code or syntax.
Using the Q&A feature, you can explore more specific insights by double clicking an empty part of your report canvas and using the ‘Ask a Question’ box to ask data-specific questions like “what were the sales for [region] by quarter”.
8. You can embed Power BI tiles into your custom PowerApps apps.
 Power BI's native integration with PowerApps allows you to send contextual data to your PowerApps app that updates in real-time as you make changes to your Power BI report, letting your end-users access live data insights while using your in-house developed custom applications within the same interface.
The ever-growing set of tools that Power BI contain holds the potential to provide with real, compelling, and actionable insights from data, via dashboard-style reports. Power BI has various benefits that can help you and your organizations improve on your business intelligence. With this, you now have a clear picture of various working ways of Power BI, which will help you execute the same. Now is the time to leverage the many tools and services available that can help you prepare for a successful Power BI adoption and improve your data insights across the organization.
Power BI's native integration with PowerApps allows you to send contextual data to your PowerApps app that updates in real-time as you make changes to your Power BI report, letting your end-users access live data insights while using your in-house developed custom applications within the same interface.
The ever-growing set of tools that Power BI contain holds the potential to provide with real, compelling, and actionable insights from data, via dashboard-style reports. Power BI has various benefits that can help you and your organizations improve on your business intelligence. With this, you now have a clear picture of various working ways of Power BI, which will help you execute the same. Now is the time to leverage the many tools and services available that can help you prepare for a successful Power BI adoption and improve your data insights across the organization.
In this digital age, we are extremely reliant on data – and the amount of data companies are creating is continually increasing. While all this data is inevitable, it is useless unless companies gain insights and meaning from it - to gain tangible value.
Historically, data analysis, app creation or automation would be achieved by IT/Development teams. This would require staff to outline their requirements and aims, submit these requests to their IT department (or even an external partner) and then see whether it was approved and subsequently, wait for it to be built. This would be time-consuming and would use valuable resources internally or be costly if fulfilled externally. What are more, those requesting the solution would tend to have an immediate need and waiting for weeks could cause internal delays.
Therefore, the Power Platform is so exciting. The Power Platform enables data democratization – the ability for digital information to be accessible to the typical (non-technical) end user. It provides three technologies that allow staff to do more with their data themselves without coding knowledge. While it does not allow the intricacies and flexibility of custom coding, it does provide a simple method for most users to be able to create, automate or analyze their data in ways which have never been possible for the average worker.
Power BI is a business analytics tool which allows you to easily connect to data sources, create visuals and gain business intelligence quickly. Power BI is a business analytics service provided by Microsoft that lets you visualize your data and share insights. It converts data from different sources to build interactive dashboards and Business Intelligence reports.
Power BI is a cloud-based business analytic solution, which is used to analyze data from a wide range of data sources. It is simple to use as well as user-friendly. The insights obtained can be shared across an organization and can be rooted in the organization’s app or website. With Power BI, you can create as well as productive with the reports and analytics.
How Power BI benefits businesses?
Business Intelligence, BI is a concept that usually involves the delivery and integration of relevant and useful business information in an organization. Companies use BI to detect significant events and identify/monitor business trends to adapt quickly to their changing environment and a scenario. If you use effective business intelligence training in your organization, you can improve the decision-making processes at all levels of management and improve your tactical strategic management processes.
Microsoft Power BI is a suite of business intelligence (BI), reporting, and data visualization tools and services for businesses. It converts your raw data into dashboards and visualizations. This allows you to analyze your data more efficiently, spot trends and patterns, and obtain actionable insights to make better business decisions.
It allows you to:
• Click and connect with Microsoft and third-party cloud services, as well as on-premises data sources.
• Gives you access to real-time information. Supports a wide range of data sources and integrations.
• Allows you to build personalized dashboards and interactive reports easily.
• Easily manipulate data and create visuals, such as charts, dashboards, maps and many more – so you can present your data in an easy-to-digest format.
• Allows you to deploy multiple dashboards with Power BI Apps.
• Have cutting-edge AI feature.
• Use natural language to query data and get results (i.e., “show me our sales pipeline for 2018 by month, by salesperson”)
• Overall, allowing you to easily analyze and make sense of complex data to enable continual improvement.
• Is affordable and cost-effective.
Why should you use Power BI?
Power BI offers data preparation and discovery, interactive dashboards, and rich visualizations in one solution, and its self-service capabilities make it an intuitive tool for interacting with data and turning it into insights more easily. Here are our top 8 reasons why you should use Power BI for data analytics and self-service business analytics.
1. It is easy to connect your data together.
Power BI makes it incredibly easy to bring your data together into one place, for greater accessibility, organization, and visibility in your reporting efforts. The tool currently supports up to 70+ connectors out-of-the-box, letting businesses load data from a wide range of highly used cloud-based sources such as Azure (Azure Data Warehouse), DropBox, Google Analytics, OneDrive and SalesForce, in addition to Excel spreadsheets, CSV files and data located on-premises, such as SQL Database.
2. It is powerful and performant.
Power BI’s Power Pivot data modelling engine (which is shared with Excel) is a highly performant columnar database.
3. It has custom, open sources visuals.
Power BI comes with a ton of pre-packed standard data visuals to leverage in your interactive reports, such as bar, column, line, map, matrix, pie charts, scatter, table and waterfall - each with their own variety of customization options for enhanced presentation and functionality.
4. Advanced data experts can leverage its native R integration.
Power BI lets you integrate these detailed R visualizations directly into a standard dashboard.
5. Enable more advanced analytics with familiar Excel features.
Advanced Excel users knowledgeable in Data Analysis Expressions (DAX) formula language can dig deeper into their data and find patterns easier with Power BI with its familiar Power Pivot features like clustering, forecasting, grouping and quick measures.
6. It brings together data governance and security.
Power BI lets you manage security and user access and security within the same interface, removing the need to use other tools to ensure you meet stringent compliance and regulatory standards.
The service also has Azure Active Directory (AAD) built-in for user authentication, allowing you to leverage Single Sign-On (SSO), along with your regular Power BI login credentials to access your data.
7. You can ask questions and get answers about your data.
Power BI incorporates natural language search interfaces to allow users to create visualizations and discover insights using search terms in plain English, without the need for code or syntax.
Using the Q&A feature, you can explore more specific insights by double clicking an empty part of your report canvas and using the ‘Ask a Question’ box to ask data-specific questions like “what were the sales for [region] by quarter”.
8. You can embed Power BI tiles into your custom PowerApps apps.
Power BI's native integration with PowerApps allows you to send contextual data to your PowerApps app that updates in real-time as you make changes to your Power BI report, letting your end-users access live data insights while using your in-house developed custom applications within the same interface.
The ever-growing set of tools that Power BI contain holds the potential to provide with real, compelling, and actionable insights from data, via dashboard-style reports. Power BI has various benefits that can help you and your organizations improve on your business intelligence. With this, you now have a clear picture of various working ways of Power BI, which will help you execute the same. Now is the time to leverage the many tools and services available that can help you prepare for a successful Power BI adoption and improve your data insights across the organization. Categories: Business Intelligence